This report covers all the S&P 500 stocks.
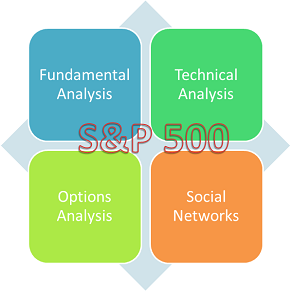
The report is based on company specific information from social networks, stock price data, options data, company fundamental data, and the corresponding sector and industry information.
Our proprietary algorithm incorporates all these data and generates predictive analysis on each of the 500 stocks.
The report provides a list of stocks for put selling. Options expiration dates are provided. Strike prices are determined by the delta value of the put options. We suggest delta between -0.3 and -0.2, and choose the one closest to -0.2. Options are selected if (Option Sell Price*100)/(Option Strike Price) between 0 and 1.
The trading strategy is the following.
1. Sell the selected put option.
2. Monitor whether the put option price increases over 200%. If so, buy back the put option. Otherwise, let the option expire or buy it back when the option price drops to pennies.